A/B TESTING (REPORTS)
The A/B Testing panel, accessible by selecting the A/B Testing name from the list of reports on the Reports panel, provides settings and functions to generate the A/B Testing report. This report provides the ability to compare the performance of 2 different messages that were sent for the same campaign flow. It enables data-driven optimization of user journeys through clear, comparative insights. It includes detailed metrics such as barcode conversion rates (calculated as redeemed barcodes divided by sent barcodes) and percentage performance rates for each message. It can be exported and downloaded to a PDF file or XLS file after it's generated.
Important: The A/B Testing report is only available for campaign flows the utilize the A/B TESTING trigger's message configuration.
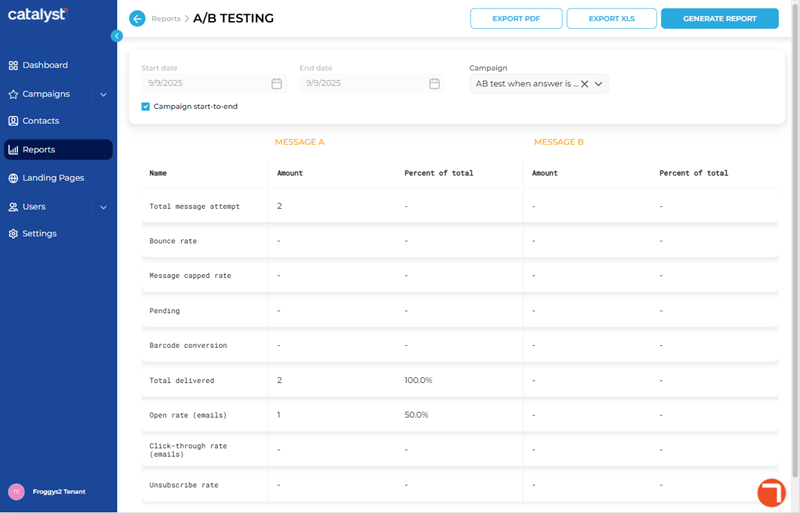
Report Settings
The A/B TESTING panel's report parameters include time period (user-specified up to 365 days in length or campaign start-to-end) and specific campaign settings.
Start date | End date
The Start date and End date parameters provide the ability to generate the report for a specific date range.
Important: The maximum date range length that can be specified is 365 days. Additionally, specifying a date range disables the Campaign start-to-end setting.
Start date
The Start date parameter provides the first day to include in the report, in MMDDYYYY format. It can be manually entered or selected from the provided calendar.
End date
The End date parameter provides the last day to include in the report in MMDDYYYY format. It can be manually entered or selected from the provided calendar.
Campaign start-to-end
The Campaign start-to-end parameter provides the ability to generate the report for the campaign's full time period.
Important: Selecting this parameter disables the Start date and End date settings.
Campaign
This drop-down provides a list of campaigns, from which one can be selected to generate the report.
Important: Only campaigns with a flow that includes the A/B TESTING trigger can be selected here.
EXPORT PDF
The function provides the ability to download a PDF copy of the A/B Testing report, after the report is generated. The function is disabled when the A/B Testing panel first opens; it is enabled after the report is generated.
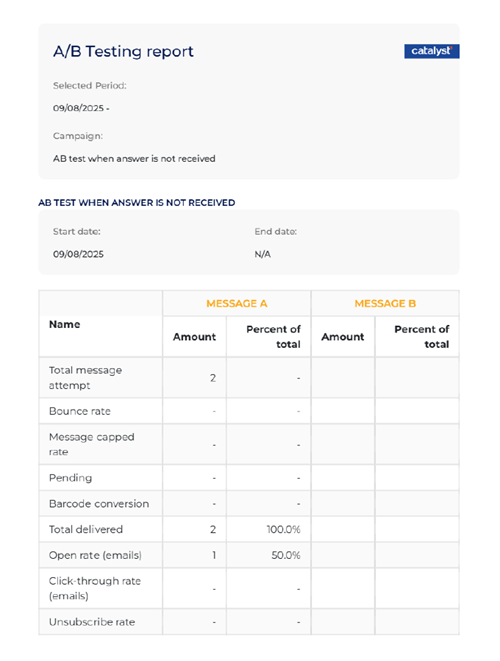
Filename Format
The PDF filename format is <CAMPAIGN NAME> A_B Testing MM_DD_YYYY.pdf, where <CAMPAIGN NAME> is the name of the selected campaign and MM_DD_YYYY is the end date of the report.
Download Location
The PDF file is generated and automatically downloaded to the download location configured for the web browser from which the report is generated.
EXPORT XLS
The function provides the ability to download an XLS copy of the A/B Testing report, after the report is generated. The function is disabled when the A/B Testing panel first opens; it is enabled after the report is generated.
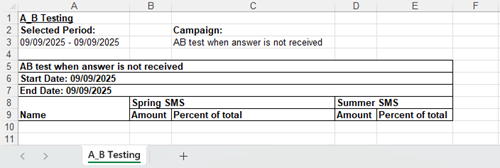
Filename Format
The XLS filename format is <CAMPAIGN NAME> A_B Testing MM_DD_YYYY.xls, where <CAMPAIGN NAME> is the name of the selected campaign and MM_DD_YYYY is the end date of the report.
Download Location
The XLS file is generated and automatically downloaded to the download location configured for the web browser from which the report is generated.
GENERATE REPORT
The function generates the A/B Testing report for the configured parameters.
Report Data
Total message attempt
The Total message attempt metric provides the number of messages that were sent. Note that Percent of total column will always be a dash.
Bounce rate
The Bounce rate metric provides the number and percentage of messages that were sent, but could not be delivered. Note that this value does NOT include capped messages or pending messages.
Message capped rate
The Message capped rate metric provides the number and percentage of messages that were sent, but that could not be delivered because the recipients met the maximum number of messages they could receive.
Pending
The Pending metric provides the number and percentage of messages that were sent, but not yet delivered.
Barcode conversion
The Barcode conversion metric provides the number and percentage of barcodes redeemed from the messages that were sent.
Note: The percentage for this metric is calculated from the number of messages sent; not from the number of messages delivered or opened.
Total delivered
The Total delivered metric provides the number and percentage of messages that were successfully delivered to a recipient. It is calculated from the Total message attempt value, less the Bounce rate value, less the Message capped rate value, and less the Pending value
Open rate (emails)
The Open rate (emails) metric provides the number and percentage of messages that were successfully delivered and opened by a recipient.
Important: This metric is only available for email messages. A dash appears here for SMS messages.
Click-through rate (emails)
The Click-through rate (emails) metric provides the number and percentage of messages that were successfully delivered and opened by a recipient, who then also selected and opened a link in the message.
Important: This metric is only available for email messages. A dash appears here for SMS messages.
Unsubscribe rate
The Unsubscribe rate metric provides the number and percentage of recipients who selected the function in the message to opt out from receiving any future messages. This metric is available for email and SMS messages.
Updated: 081026